


Analytic Brief
fosphorus is a powerful, GPU-accelerated software application that transforms Software Defined Radios into real-time spectrum analyzers. It provides high-speed, gap-free visualization of radio frequency signals as a dynamic heatmap, enabling the detection and analysis of even fleeting transmissions. Its increasing accessibility through support for affordable hardware, as seen in its evolution, democratizes advanced signal intelligence capabilities, presenting both significant opportunities for legitimate research and
The development of fosphorus stems from efforts to create a high-performance, visually intuitive spectrum display. While specific individual developers are credited with contributions, the broader “who” encompasses a community of open-source enthusiasts and engineers. The user base is diverse, ranging from amateur radio operators and academic researchers to professionals in wireless protocol development, cybersecurity, and signal intelligence. The software’s design, which leverages general-purpose computing hardware and readily available Software Defined Radios like the HackRF One, Pluto SDR, and the widely accessible RTL-SDR, broadens its reach to individuals and organizations who may not have access to multi-million dollar professional Real-Time Spectrum Analyzers.
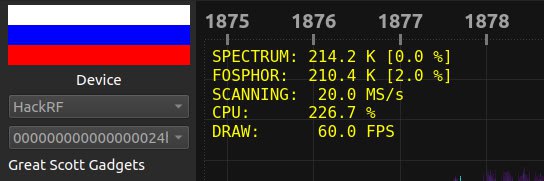
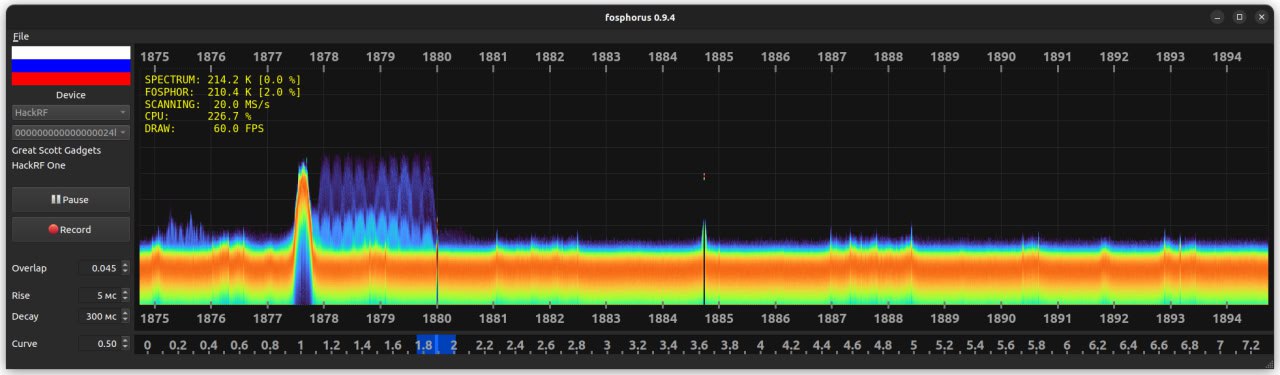
fosphorus is a real-time spectrum visualization tool that displays the radio frequency spectrum as a dynamic heatmap, often referred to as a “phosphor” display. This visual representation, clearly depicted in Image 3, showing the application’s main window, emulates the persistence effect of traditional instruments, allowing users to observe signal intensity across frequency and time. The application operates on Linux Debian/Ubuntu and Windows 10 and higher. Its core capabilities include automatic detection of connected SDR devices, a multithreaded architecture that separates tasks like device reading, spectrum calculation, and heatmap updating, and high-speed processing capable of 200 thousand spectrum and heatmap calculations per second on an AMD Ryzen 5 processor. As shown in Image 2, the statistics panel provides real-time metrics such as SPECTRUM calculation rates, FOSPHOR heatmap update rates, SCANNING sample rates (e.g., 20 million samples per second for HackRF), CPU load (e.g., 226.7 percent), and DRAW rendering frames per second (e.g., 60 FPS).
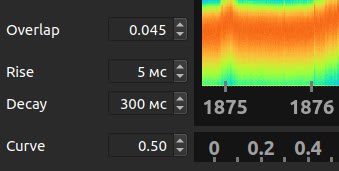
The software also offers essential functions for recording and playing back In-phase/Quadrature IQ signals to and from a proprietary file format. User-configurable parameters, visible in Image 1, include “Overlap” (e.g., 0.045), which controls the floating window’s shift for IQ sample processing, “Rise” (e.g., 5 MC), determining the average appearance time of the spectrum on the heatmap, and “Decay” (e.g., 300 MC), which governs the average decay time. These parameters allow fine-tuning of the visualization to highlight transient or persistent signals. Recent updates have expanded hardware support to include Pluto SDR and RTL-SDR, added features like bandwidth measurement by mouse cursor, and enabled switching of SDR sampling frequencies for signal band zooming.
The significance of fosphorus lies in its ability to democratize advanced real-time spectrum analysis. Historically, the capability to capture every signal without “blind times” and visualize transient events was exclusive to expensive, dedicated Real-Time Spectrum Analyzers. fosphorus, by implementing parallel processing, GPU acceleration, and high FFT update rates on consumer-grade hardware, effectively brings these sophisticated functions to a much wider audience, meaning that detailed analysis of complex, dynamic RF environments, including the identification of frequency hopping patterns, intermittent bursts, or short glitches, is no longer cost-prohibitive. The “Overlap” parameter, for instance, directly mirrors the critical FFT Overlapping technique used in professional RTSAs to ensure accurate level measurements of short events. Similarly, the “Rise” and “Decay” parameters for the heatmap directly correspond to persistence settings in high-end analyzers, allowing for the visualization of signal probability over time. This accessibility lowers the barrier to entry for various activities, from legitimate academic research and amateur radio exploration to more sensitive applications in wireless cybersecurity and passive signal intelligence gathering.
The timing of fosphorus’s increasing prominence is driven by several factors. The continuous evolution of the software, notably the addition of support for widely available and inexpensive Software Defined Radios like the RTL-SDR in version 0.9.5, makes advanced real-time spectrum analysis more accessible than ever before. This expansion aligns with the growing proliferation of wireless technologies and the increasing complexity of the radio frequency spectrum. As more devices operate wirelessly, the need for practical tools to monitor, analyze, and understand this invisible landscape becomes critical. The images provided, particularly Image 3, showcase a mature and functional application interface, indicating a stable and usable tool ready for broader adoption. The ongoing development and refinement of features, such as the change in the IQ file format, underscore a commitment to enhancing its capabilities.
The impact of fosphorus has been to empower a broader range of users with sophisticated RF analysis capabilities. It has enabled hobbyists to delve deeper into spectrum exploration, provided researchers with an affordable platform for signal processing experiments, and offered cybersecurity professionals a valuable tool for wireless vulnerability assessment. By making real-time, gap-free spectrum monitoring accessible, fosphorus has facilitated the identification and characterization of signals that might otherwise go undetected by less capable equipment. Its ability to record raw IQ data allows for detailed offline forensic analysis, further extending its utility. The performance metrics, such as 214.2 thousand spectrum calculations per second with zero losses, demonstrate its practical effectiveness on standard computing platforms. The performance effectively broadened the pool of actors capable of performing advanced wireless reconnaissance, shifting the landscape of signal analysis from a niche, high-cost domain to a more widely accessible field.
Looking ahead, the trajectory of fosphorus suggests a future where advanced wireless analysis tools become increasingly ubiquitous and integrated into general computing environments. The continued development of such software, coupled with the ongoing innovation in Software Defined Radio hardware, will likely lead to even more powerful and user-friendly applications. This trend implies a future where sophisticated signal intelligence and electronic warfare reconnaissance capabilities are no longer exclusive to state-level actors or well-funded organizations. Individuals and non-state groups will continue to gain access to tools capable of detailed spectrum analysis, including the identification of complex modulation schemes, frequency hopping patterns, and transient emissions. This democratization of capability will necessitate increased vigilance in spectrum management, robust wireless cybersecurity defenses, and a proactive approach to understanding and mitigating potential threats arising from widely accessible advanced RF analysis tools. The dual-use nature of fosphorus will remain a central consideration, requiring ongoing assessment of its applications in both legitimate and sensitive contexts.
Analysis
fosphorus is a GPU-accelerated real-time spectrum visualization application engineered explicitly for use with Software Defined Radios. Its core functionality involves displaying the radio frequency spectrum as a dynamic heatmap, enabling high-speed signal analysis and the capture of transient events. The application offers robust capabilities such as In-phase/Quadrature (IQ) signal recording and playback, alongside broad compatibility with various SDR hardware platforms. The development of fosphorus marks a significant step in democratizing advanced signal analysis techniques, making sophisticated spectral observation accessible to a broader array of users. This report provides a detailed examination of fosphorus’s technical underpinnings, operational features, and its broader implications, including its inherent dual-use nature for both legitimate and more sensitive operational contexts.
fosphorus and Its Evolution
fosphorus serves as a fundamental tool for real-time, GPU-accelerated visualization of the radio frequency spectrum, presenting data as a dynamic heatmap. This approach emulates the persistence effect observed in traditional cathode ray tube instruments, offering a visual representation of signal intensity across frequency and time. The software’s origins can be traced to the earlier “fosphor” project, which aimed to re-implement spectrum visualization with high performance and GPU acceleration, drawing parallels to professional Real-Time Spectrum Analyzers (RTSA) such as those offered by Agilent, Tektronix, or Rohde & Schwarz. The initial impetus behind “fosphor” was to create a fast, intuitive, and visually engaging spectrum display capable of capturing fleeting transients or bursts, all while minimizing the load on the central processing unit.
The progression of fosphorus through its versions, specifically 0.9.4 and 0.9.5, illustrates a deliberate expansion of its capabilities and accessibility. Version 0.9.4 laid the groundwork by supporting Linux distributions based on Debian and Ubuntu, as well as Windows 10 and newer operating systems. Initial hardware compatibility included HackRF One Software Defined Radio.
The subsequent release, fosphorus 0.9.5, introduced substantial enhancements. This version expanded hardware support to include Pluto SDR, along with clones that interface via the IIO API, and notably added compatibility for RTL-SDR. The inclusion of RTL-SDR, a widely accessible and low-cost Software Defined Radio platform, is a critical development. This expansion into highly accessible and affordable SDRs represents a significant trend towards making advanced real-time spectrum analysis capabilities widely available. While professional Real-Time Spectrum Analyzers traditionally require sophisticated and expensive dedicated hardware, fosphorus, by enabling these advanced functions on inexpensive, consumer-grade SDRs, effectively lowers the financial and technical barriers to performing sophisticated signal analysis. The ‘low cost’ broadens the user base significantly, fostering innovation in areas like amateur radio and academic research, while also expanding the pool of potential actors capable of performing advanced wireless reconnaissance or signal intelligence tasks.
Beyond hardware expansion, fosphorus 0.9.5 integrated practical analytical features such as bandwidth measurement, facilitated by dragging a mouse cursor, and the ability to switch SDR sampling frequencies for signal band “zooming” (e.g., for HackRF, options include 20 MHz, 10 MHz, and 5 MHz). The update also introduced a “hold max” spectrum display with a slow decay, providing a visual representation of maximum signal levels over time. Enhancements to the IQ signal recording and playback functionality were implemented, including an incompatible change to the .iqs file format, and the addition of user interface improvements such as toggles for various display elements within the View menu and an Auto Start option for automatic SDR activation upon application launch.
fosphorus Version Feature Comparison
The following table provides a concise comparison of key features and supports hardware across fosphorus versions 0.9.4 and 0.9.5, highlighting the software’s development trajectory and increased utility.
| Feature Category | fosphorus 0.9.4 | fosphorus 0.9.5 (Enhancements) |
| Supported OS | Linux (Debian/Ubuntu), Windows 10+ | No change |
| Supported SDRs | HackRF One | Pluto SDR (including IP connection for clones like libreasdr), RTL-SDR |
| Core Features | Automatic device detection, Multithreading (device read, spectrum calc, heatmap update), High speed (200K calc/sec on Ryzen 5), IQ signal recording (own format), IQ signal playback | Changed IQS file format (incompatible with old), ‘R’ key for recording |
| New Features | Not applicable | Bandwidth measurement (mouse drag), SDR sampling frequency switching (HackRF: 20, 10, 5 MHz), Hold max spectrum display (slow fall), Vertical bar for current frequency, View menu toggles (spectrum, hold max, phosphor, stats), Auto Start toggle, ‘i’ key for statistics, Status bar device/file info |
Core Capabilities and Functional Architecture
The fundamental capability of fosphorus lies in its dynamic heatmap visualization of the signal spectrum, often termed a “phosphor” display, which effectively emulates the persistence characteristics of older cathode ray tube instruments. This heatmap offers a visual representation of signal intensity across frequency and time, enabling users to discern transient events, assess signal occupancy, and observe spectral dynamics. This visualization is conceptually like the “Persistence Spectrum” or “Spectral Histogram” display modes found in professional Real-Time Spectrum Analyzers, which illustrate the probability of a given frequency-level pair appearing over time.
The software’s functional architecture is meticulously engineered for high performance and responsiveness. It incorporates automatic detection of SDR device connection and disconnection, ensuring a seamless operational experience. A multithreaded design is central to its operational efficiency, employing distinct threads for critical operations: reading data from the SDR device, performing spectrum calculations, and updating the heatmap display. This parallel processing methodology is a cornerstone of real-time spectrum analysis, where continuous data acquisition proceeds concurrently with data processing, thereby eliminating the “blind times” that characterize traditional swept spectrum analyzers. The combination of multithreading, GPU acceleration, and high Fast Fourier Transform (FFT) rates in fosphorus represents a direct implementation of the architectural principles necessary for achieving accurate real-time spectrum analysis, thereby validating its claim of “no blind time” operation on general-purpose computing hardware. This design choice directly addresses the need for parallel sampling and FFT calculation, ensuring that data acquisition continues uninterrupted while processing coincides.
Phosphorus achieves remarkable operational speed, reporting up to 200,000 spectrum and heatmap calculations per second on an AMD Ryzen 5 processor, with minimal data loss. This performance is mainly attributable to its GPU-accelerated design, which leverages OpenCL for computationally intensive tasks, specifically Fast Fourier Transforms, and OpenGL for rendering the complex visualizations. The FFT kernel processes incoming samples, ideally utilizing overlapping windows to capture intricate signal structures and smooth the resulting heatmap. The live spectrum, waterfall, and histogram (persistence) displays are subsequently generated from these FFT results and rendered with efficiency using OpenGL Vertex Buffer Objects and textures, with dynamic scaling and palette mapping managed by shaders. The multithreaded design allows simultaneous data acquisition, processing, and display, directly addressing the requirement for parallel sampling and FFT calculation. The GPU acceleration, as described in the research, offloads computationally intensive FFT and rendering tasks from the main CPU, enabling the fast processing of FFT algorithms necessary to keep pace with incoming data streams. This architectural synergy ensures that fosphorus can continuously process and display wideband RF data without gaps, effectively eliminating “blind times” on consumer hardware. The reported high calculation rates (200,000 “lines” per second) directly support this, demonstrating that the software can indeed keep up with the data flow, a critical criterion for any real-time analyzer, confirming fosphorus is not just a fast spectrum analyzer, but one designed with the core principles of real-time analysis in mind.
Beyond its real-time visualization capabilities, fosphorus provides the essential function of recording raw In-phase/Quadrature (IQ) signals to a proprietary file format and subsequently playing them back. This feature is indispensable for offline analysis, detailed post-processing, and forensic examination of captured radio frequency events, mirroring the I/Q memory functionality found in professional Real-Time Spectrum Analyzers for non-real-time post-processing.
Operational Parameters and Performance Metrics
fosphorus offers user-configurable parameters that profoundly influence the visualization and analysis of spectral data. The “Overlap” parameter, for instance, controls the degree of overlap in the floating window employed for processing IQ samples. A value of 1.0 indicates that the window shifts by its full length after each spectrum calculation, whereas a value of 0.5 signifies a shift by half the window’s length. Increasing this overlap, as detailed in the documentation, leads to a greater number of “lines” for spectrum calculation and heatmap updates, revealing signal structure with enhanced detail, and contributes to a smoother spectrum heatmap. The shifts come at the expense of increased processor load, directly paralleling the “FFT Overlapping” technique in professional Real-Time Spectrum Analyzers, which is crucial for preventing level errors when capturing short events and for compensating for the effects of windowing functions applied to IQ data. The Rohde & Schwarz FSVR, for example, employs an overlap factor of at least 80% to ensure accurate level measurements of transient signals.
The “Rise” parameter governs the average “appearance” time of the spectrum on the heatmap. A higher value results in a slower appearance and a “cooler” color display (closer to blue), indicating signals that are less frequent or persistent. Conversely, the “Decay” parameter controls the average “decay” time of the spectrum on the heatmap. A higher decay value means the spectrum fades more slowly and appears “warmer” in the color scheme (closer to red), signifying more persistent or frequently occurring signals. These parameters are direct implementations of the charge/discharge functions for the histogram or persistence display, effectively emulating the phosphor persistence effect to visualize how often a given FFT bin is at a particular power level.
The careful implementation and user-configurability of parameters such as “Overlap,” “Rise,” and “Decay,” combined with high scanning and FFT rates, indicate that fosphorus is specifically optimized for the detection, visualization, and characterization of transient, intermittent, or rapidly changing signals, a critical capability in advanced signal analysis. Traditional spectrum analyzers struggle with “blind times” and can miss short, infrequent events. Even when captured, visualizing these fleeting signals effectively requires specialized display modes. The high “Scanning” rate (twenty million samples per second) and high “Spectrum calculation” rate (214.2 thousand “lines” per second) of fosphorus ensure that no signal information is lost, even for very short events. The “Overlap” parameter, when increased, shows the signal structure in more detail and increases the number of “lines” for spectrum calculation, which is essential for accurate power level measurements of transient pulses by preventing energy distribution across multiple FFTs. Furthermore, the “Rise” and “Decay” parameters directly control the persistence of signals on the heatmap, allowing users to tune the visualization to effectively highlight and distinguish between intermittent bursts, continuous wave signals, and frequency hopping patterns, which are typical applications for real-time analyzers. This synergy of features demonstrates a deliberate design choice to optimize for transient signal analysis, extending fosphorus’s utility far beyond simple spectrum monitoring, enabling detailed analysis of complex, dynamic RF environments, which is a hallmark of professional signal intelligence and electronic warfare applications.
Performance statistics for fosphorus 0.9.4, as measured on an AMD Ryzen 5 system, clearly illustrate its computational efficiency. The software achieves 214.2 thousand spectrum calculation “lines” per second with zero losses. Heatmap updates occur at a rate of 210.4 thousand “lines” per second, with only a 2% loss rate. The scanning rate is inspiring, processing twenty million samples per second, which corresponds to the full sampling rate of a HackRF at 20 MHz. The reported CPU load is 226.7%, indicating efficient utilization of just over two CPU cores, while rendering consistently maintains a smooth 60 Frames Per Second (FPS). These metrics show fosphorus’s capacity to handle high data rates and complex visualizations efficiently on consumer-grade hardware, making its performance comparable in scale to professional Real-Time Spectrum Analyzers, which boast FFT update rates of up to 250,000 per second.
Furthermore, fosphorus 0.9.5 enhances operational utility with additional features. These include bandwidth measurement by dragging the mouse cursor and the ability to switch SDR sampling frequencies (e.g., for HackRF, 20 MHz, 10 MHz, and 5 MHz) for “zooming” the signal band, providing greater flexibility in analyzing specific frequency ranges.
Key Performance Metrics of fosphorus 0.9.4 (AMD Ryzen 5)
The following table summarizes the quantitative performance data reported for fosphorus, providing a clear and concise snapshot of the software’s processing power and efficiency on a typical consumer system.
| Metric | Value | Notes |
| Spectrum calculation | 214.2 thousand lines/second | Zero losses |
| Heatmap update | 210.4 thousand lines/second | Two percent losses |
| Scanning | Twenty million samples/second | Corresponds to HackRF at 20 MHz sampling rate |
| CPU load | 226.7% | Utilizes full power of just over two CPU cores |
| Rendering | 60 FPS | Frames Per Second |
Comparative Context and Real-Time Spectrum Analysis
To fully appreciate the capabilities of fosphorus, it is essential to position it within the broader landscape of real-time spectrum analysis. Real-time spectrum analysis fundamentally means capturing every signal without loss of information, effectively eliminating “blind times,” achieved by continuously acquiring wide frequency ranges using high-resolution analog-to-digital converters (ADCs) and processing this data in parallel through fast Fast Fourier Transform (FFT) algorithms, often implemented in dedicated hardware such as Field-Programmable Gate Arrays (FPGAs). This parallel processing paradigm is crucial for overcoming the limitations of traditional swept spectrum analyzers, which sequentially capture and analyze data, inevitably missing events that occur between sweeps.
fosphorus embodies these core principles of real-time analysis. Its multithreaded architecture and GPU acceleration for FFT calculations directly mirror the parallel sampling and processing pipeline found in professional Real-Time Spectrum Analyzers (RTSA) like the Rohde & Schwarz FSVR. While professional RTSAs rely on specialized ASICs and FPGAs for their immense processing power, capable of achieving rates such as 250,000 FFTs per second on the R&S FSVR, fosphorus achieves comparable rates on general-purpose computing hardware by intelligently leveraging modern CPU multithreading and GPU parallel processing capabilities.
Key features within fosphorus, such as the “Overlap” parameter, directly correspond to the critical “FFT Overlapping” technique employed in RTSAs. This technique reuses samples from preceding FFTs to ensure that short events are fully captured and accurately measured, mitigating level errors that can arise from windowing functions. Similarly, fosphorus’s “Rise” and “Decay” parameters for its “phosphorus” heatmap display are direct analogues to the “Persistence Granularity” and “Persistence” settings found in RTSAs. These settings are used to create a “Persistence Spectrum” or “Spectral Histogram” that visualizes signal probability and transient behavior over time.
fosphorus effectively translates the sophisticated principles and display techniques of high-end, dedicated Real-Time Spectrum Analyzers into a software-defined, accessible platform, making advanced signal analysis capabilities available to a much broader user base. This capability translation arises from a direct functional and conceptual correspondence between fosphorus’s features and the established RTSA principles. For instance, fosphorus’s multithreading and GPU acceleration directly align with the parallel sampling and FFT calculation fundamental to RTSAs. Its high spectrum calculation rate parallels the high FFT update rates of professional devices. The “Overlap” parameter is functionally equivalent to FFT Overlapping, and the “phosphorus” heatmap with “Rise” and “Decay” settings mirrors the Persistence Spectrum or Spectral Histogram. This strong correspondence indicates that fosphorus is not merely a basic spectrum viewer; it is a sophisticated software application that successfully implements complex algorithms and display methodologies traditionally confined to expensive, purpose-built hardware. It translates the high-performance, gap-free analysis capabilities of professional RTSAs into a software package that can run on consumer-grade computers with affordable Software Defined Radios. The ability to run on consumer-grade computers significantly democratizes access to advanced signal analysis techniques, enabling a wider range of users to perform tasks that were previously cost-prohibitive.
Although fosphorus operates on Software Defined Radios and general computing platforms, its design philosophy and functional implementation demonstrate a precise adherence to the rigorous technical requirements of real-time spectrum analysis. It effectively bridges the gap between high-cost, dedicated hardware solutions and accessible, software-driven alternatives.
fosphorus Parameters and Their Real-Time Spectrum Analysis Equivalents
The following table maps specific parameters and display modes of fosphorus to their conceptual and functional equivalents in professional Real-Time Spectrum Analyzers, aiding in understanding fosphorus’s advanced capabilities for users familiar with high-end equipment.
| fosphorus Parameter/Feature | fosphorus Description | RTSA Equivalent Term | RTSA Function/Significance |
| Overlap | Controls overlap of floating window for IQ samples; increases “lines,” detail, smoothing; increases CPU load | FFT Overlapping | Reuses samples to prevent level errors for short events; compensates for windowing effects |
| Rise | Average “appearance” time of spectrum on heatmap; higher value means slower appearance, “cooler” color (blue) | Persistence Granularity / Persistence | Controls how quickly signals appear/build intensity on persistence display; part of histogram calculation |
| Decay | Average “decay” time of spectrum on heatmap; higher value means slower decay, “warmer” color (red) | Persistence / Persistence Granularity | Controls how quickly signals fade on persistence display; part of histogram calculation |
| Heatmap / “phosphorus” display | Displays signal spectrum as a dynamic heatmap | Persistence Spectrum / Spectral Histogram | Visualizes probability of appearance for each frequency-level pair; helps view short events and distinguish fast changes |
| IQ Signal Recording/Playback | Records raw IQ signal to file (own format); plays back from file | I/Q Memory | Stores raw I/Q data for offline post-processing, zooming, and forensic analysis |
| High Speed (e.g., 200K calc/sec) | Rate of spectrum and heatmap calculations | FFT Update Rate (e.g., 250K FFTs/sec) | Crucial for real-time analysis to avoid “blind times” and react quickly to signal changes |
Applications and User Profiles
The capabilities inherent in fosphorus lend themselves to a wide array of applications, primarily focused on the detailed observation and analysis of radio frequency signals. Its core utility resides in real-time signal monitoring, enabling users to visualize dynamic spectral environments. The functionality is invaluable for identifying active frequencies, characterizing signal types, and detecting intermittent or transient transmissions that conventional swept spectrum analyzers might otherwise miss.
Specific applications of fosphorus include:
- Amateur Radio and Hobbyist Use: For radio enthusiasts, fosphorus provides a powerful instrument for exploring the RF spectrum, identifying amateur radio transmissions, and gaining an understanding of propagation conditions.
- Academic Research and Education: The software serves as an excellent platform for both teaching and conducting research in signal processing, wireless communications, and radio frequency engineering, offering a practical, hands-on approach to real-time spectrum analysis without the necessity of expensive, dedicated hardware.
- Interference Analysis: The ability to visualize signal persistence and transient events makes fosphorus highly effective in identifying sources of electromagnetic interference (EMI) and analyzing their characteristics, such as frequency hopping patterns or short bursts.
- Wireless Protocol Development and Debugging: Developers engaged in wireless device creation can utilize fosphorus to monitor their device’s RF emissions, debug transmission issues, and ensure adherence to spectral masks.
- Signal Intelligence (SIGINT) and Reconnaissance: Its high-speed, gap-free monitoring, wideband capabilities, and IQ recording features position it as a potent tool for passive collection of wireless communications, identification of operational frequencies, and characterization of unknown or proprietary signals.
The typical user base for fosphorus is consequently broad, encompassing:
- Radio Amateurs and Enthusiasts: Individuals with an interest in exploring the RF spectrum.
- Students and Educators: Those involved in fields such as electrical engineering, computer science, and related disciplines.
- Researchers and Developers: Professionals working on wireless technologies, Internet of Things (IoT) devices, and embedded systems.
- Cybersecurity Professionals and Signal Intelligence Analysts: Individuals or teams focused on wireless security, vulnerability assessment, and passive intelligence gathering.
Assessment of Malicious Potential and Misuse
It is imperative to state clearly that fosphorus, as a software application, is not inherently malicious. It is fundamentally a tool designed for signal analysis and visualization. However, like other powerful technical instruments, its capabilities can be leveraged for purposes beyond benign observation, including those with potentially malicious or sensitive implications. The assessment of its malicious potential, therefore, focuses on how its features could be misused for activities such as signal intelligence gathering, reconnaissance for electronic warfare, or reverse engineering of wireless protocols.
Key capabilities that contribute to this potential for misuse include:
- High-Speed, Gap-Free Real-Time Monitoring: The ability of fosphorus to continuously capture and display wideband spectrum without “blind times” makes it exceptionally effective for detecting and characterizing transient or intermittent signals. This capability is critical for passive signal intelligence (SIGINT), allowing an actor to identify operational frequencies, modulation types, and communication patterns of target systems, even if they employ frequency hopping or burst transmissions.
- Wideband Spectrum Analysis: Support for various Software Defined Radios, including those capable of wideband capture (e.g., HackRF One at 20 MHz), enables comprehensive surveillance of significant portions of the radio spectrum allowing for the identification of all active signals within a given band, which can be crucial for understanding an adversary’s wireless footprint or identifying potential vulnerabilities.
- IQ Signal Recording and Playback: The ability to record raw IQ data to a file provides forensic capability. This recorded data can be subjected to detailed offline analysis, demodulation, and reverse engineering using other tools, a fundamental step in understanding proprietary wireless protocols, identifying vulnerabilities, or developing exploits for wireless systems. The format change in version 0.9.5 indicates active development and refinement of this critical feature.
- Accessibility and Open-Source Nature: The software’s open-source availability means its code can be examined, understood, and potentially modified or integrated into other tools. Combined with its compatibility with widely available and inexpensive SDR hardware, particularly the RTL-SDR in version 0.9.5, this significantly lowers the barrier to entry for sophisticated wireless reconnaissance, enabling individuals or groups with limited resources, who might not afford multi-million-dollar professional Real-Time Spectrum Analyzers, to perform advanced signal analysis tasks.
fosphorus’s unique combination of advanced real-time spectrum analysis capabilities and its compatibility with highly accessible, low-cost Software Defined Radios positions it as a significant enabler in the wireless domain, potentially empowering a broader range of actors to conduct sophisticated signal intelligence and reconnaissance activities. The synthesis of its capabilities includes: the democratization of RTSA capabilities due to its support for cheap SDRs, its implementation of advanced real-time analysis features comparable to professional RTSAs (such as gap-free monitoring, transient signal capture, persistence displays, and IQ recording), and the inherent dual-use nature of such powerful signal analysis tools. When advanced capabilities, previously requiring expensive, specialized hardware, become accessible via inexpensive, off-the-shelf components and open-source software, the pool of potential users expands dramatically, including actors who might not possess the resources for traditional intelligence-grade equipment. Consequently, sophisticated wireless reconnaissance, signal intelligence gathering, and even preliminary electronic warfare analysis are no longer exclusive to state-level actors or well-funded organizations. Individuals, non-state groups, or smaller, less resourced entities can now acquire and deploy tools capable of performing tasks like identifying frequency hopping patterns, analyzing transient emissions, or reverse-engineering wireless protocols. The change is a tangible shift in the wireless threat landscape, as the ease of access to such powerful analytical capabilities means that the barrier to entry for conducting advanced wireless operations is significantly lowered, necessitating increased vigilance and defensive measures across various sectors.
While fosphorus itself does not possess transmission capabilities, which would enable direct offensive actions like jamming or spoofing, its strength lies in its reconnaissance potential. It serves as a powerful “eyes and ears” for the radio frequency spectrum, providing the crucial intelligence needed to plan and execute subsequent offensive or defensive wireless operations. Its utility for analyzing interference, identifying vulnerabilities in wireless systems, and understanding the spectral behavior of targets makes it an asset in the toolkit of both legitimate cybersecurity researchers and potentially malicious actors.
Wrap Up
fosphorus stands as a competent and significant software application within the realm of real-time spectrum analysis. By effectively leveraging GPU acceleration, multithreading, and sophisticated signal processing algorithms, it successfully translates the advanced functionalities traditionally found in high-cost, dedicated Real-Time Spectrum Analyzers to accessible Software Defined Radio platforms. Its ability to provide high-speed, gap-free visualization of the radio frequency spectrum as a dynamic heatmap, coupled with robust IQ signal recording and playback, positions it as a powerful tool for detailed signal characterization and transient event analysis. The continuous development, as evidenced by enhancements in version 0.9.5, particularly the expansion of SDR compatibility to include low-cost RTL-SDRs, shows its increasing accessibility and utility.
While fosphorus is fundamentally a benign analytical instrument, its inherent capabilities for comprehensive, real-time wireless signal observation lend it a dual-use nature. Its strengths in signal intelligence gathering, interference analysis, and wireless protocol reverse engineering mean it can be applied in contexts ranging from legitimate academic research and amateur radio to more sensitive cybersecurity and reconnaissance operations. The democratization of such advanced capabilities, driven by fosphorus’s accessible platform, necessitates a heightened awareness of the evolving threat landscape in the wireless domain.
For further operational assessment, it is recommended to:
- Investigate specific use cases for phosphorus in various operational environments to fully quantify its effectiveness in real-world scenarios.
- Explore its potential integration with other open-source or proprietary tools for automated signal classification, demodulation, and protocol analysis, thereby extending its utility beyond visualization.
- Continuously monitor its development and community discussions for new features or modifications that could further enhance its capabilities or introduce new implications for wireless security.
grcon13_munaut_fosphor Implementation of Real-Time Spectrum Analysis White Paper telecom.iqs
You must be logged in to post a comment.