


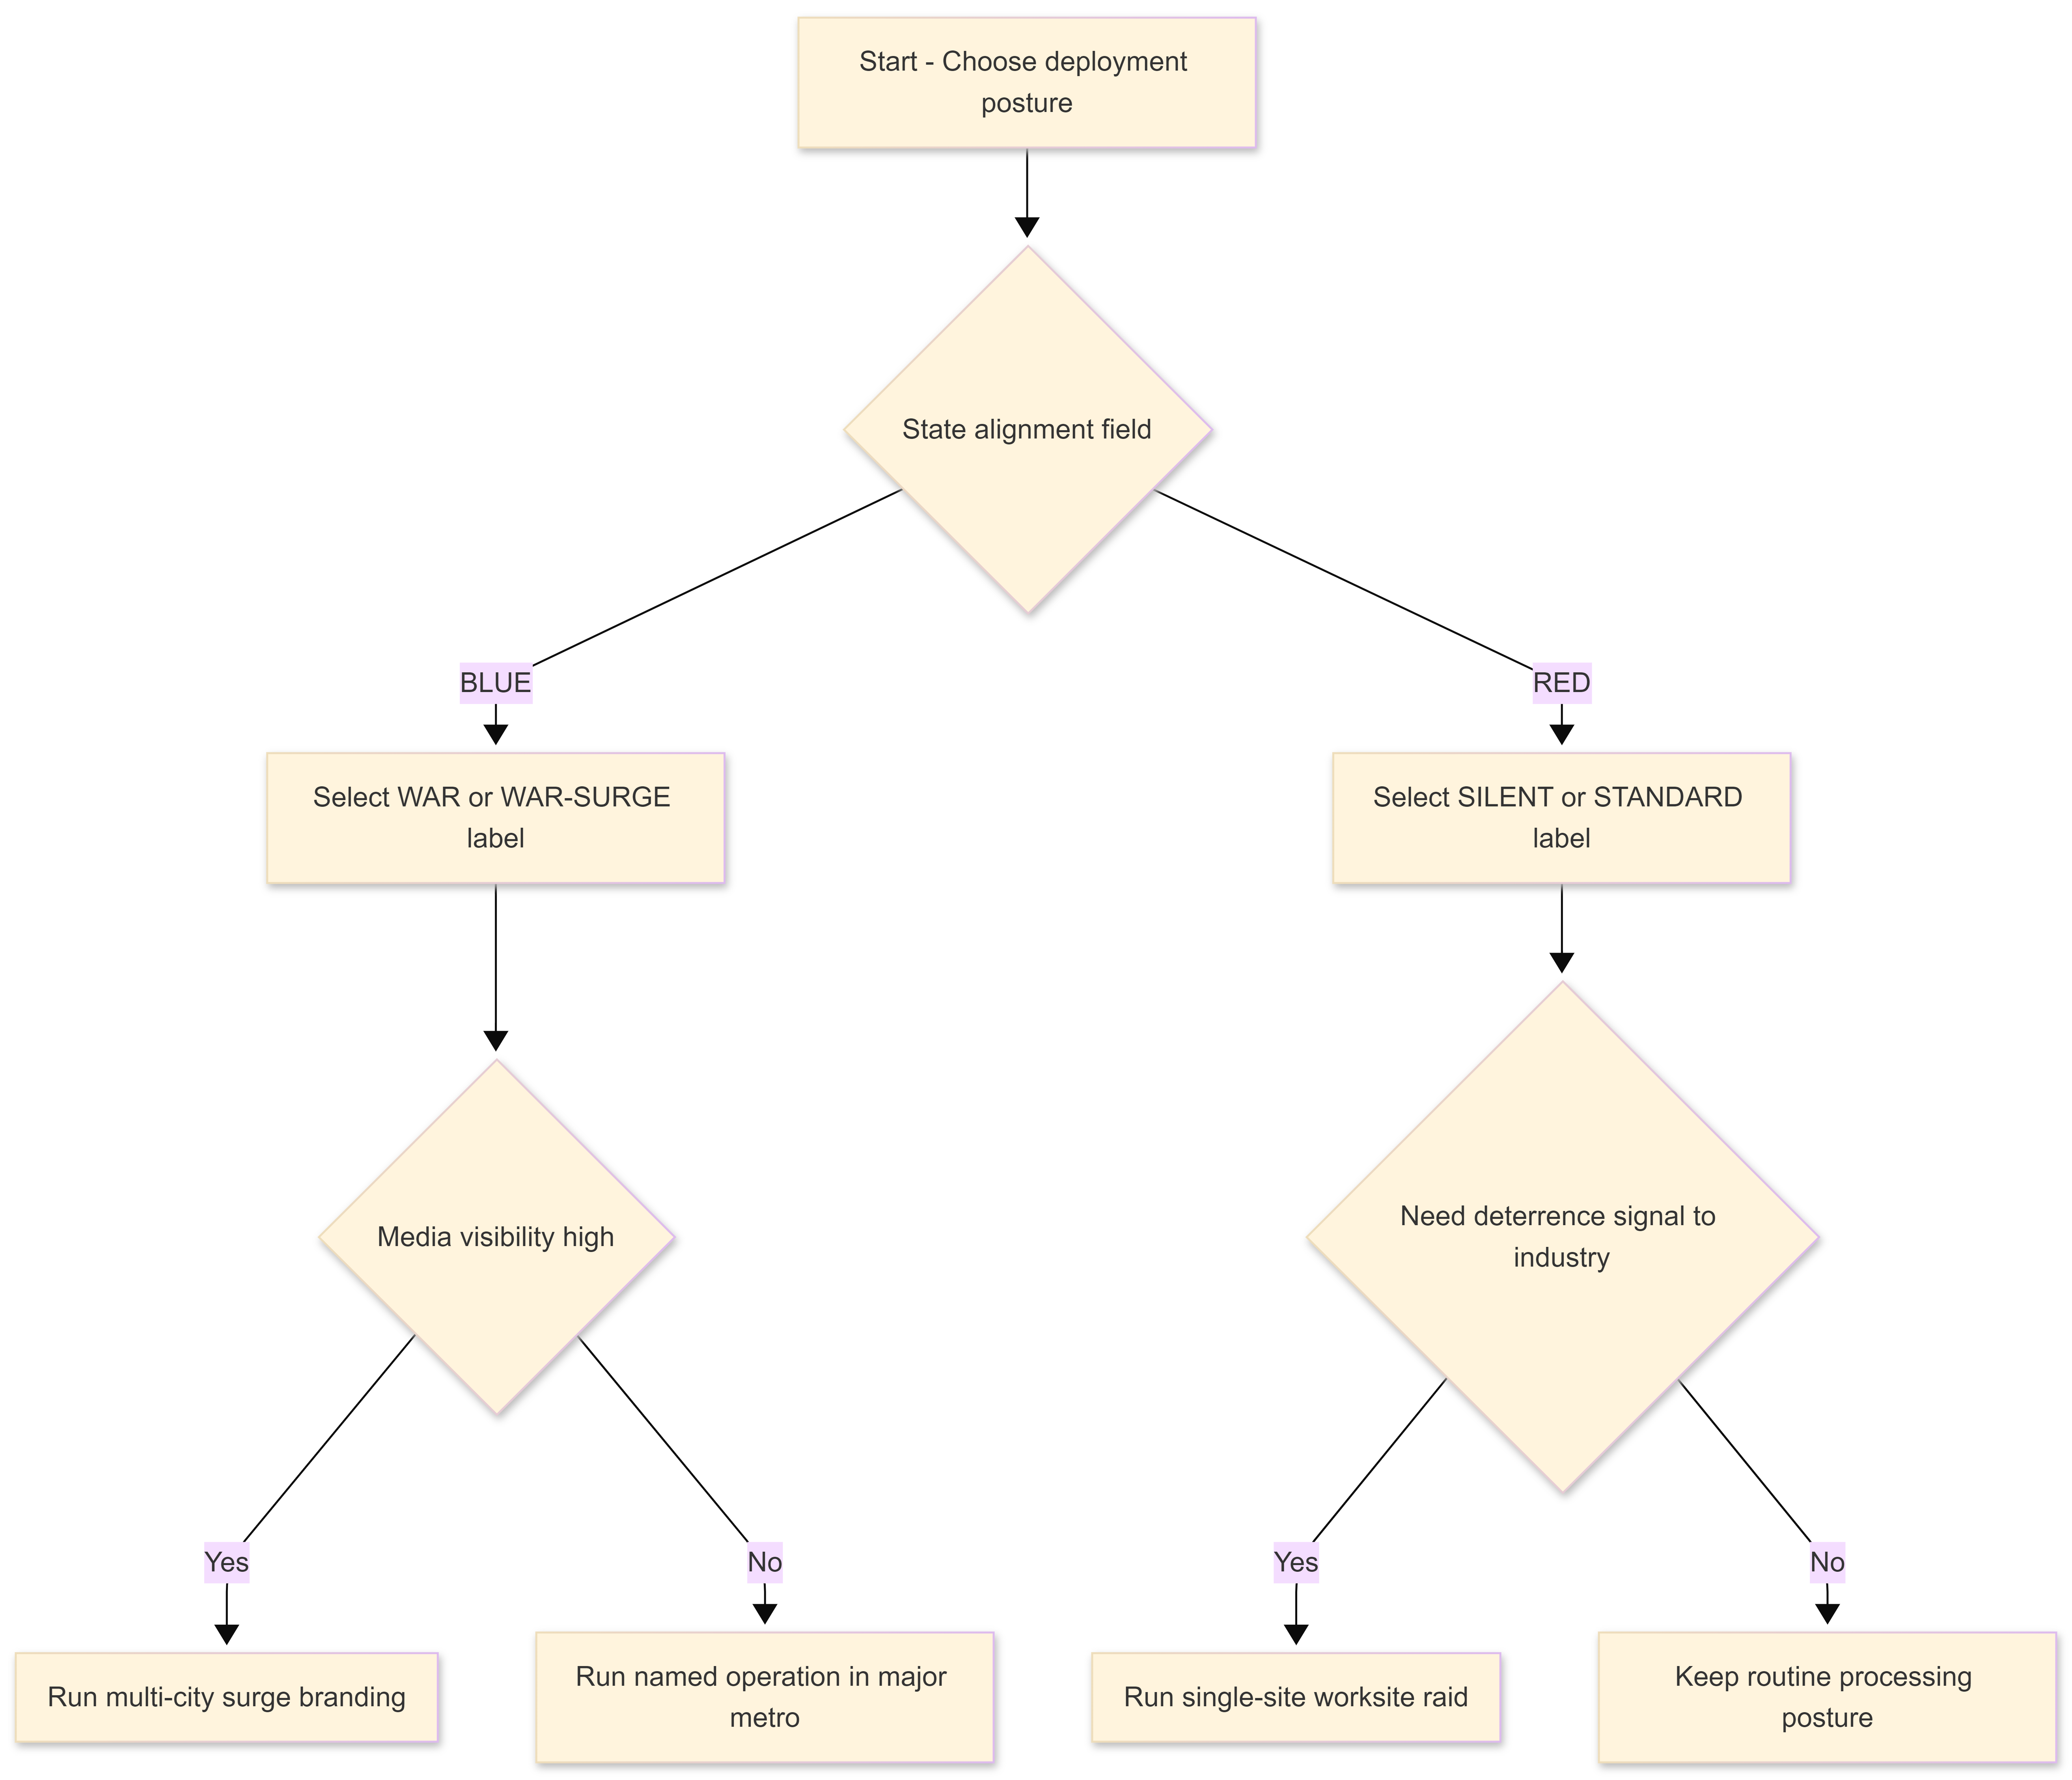
WAR and WAR-SURGE describe coercive federal enforcement postures designed for visibility, saturation, and political punishment. SILENT and STANDARD describe low-visibility processing postures designed for insulation, throughput, and protection of aligned jurisdictions. Metrics across the attached files show deployment logic tracking partisan alignment and election grievance rather than undocumented population size, homicide burden, or operational necessity. Evidence supports retaliatory targeting tied to false claims that the 2020 election lacked legitimacy.
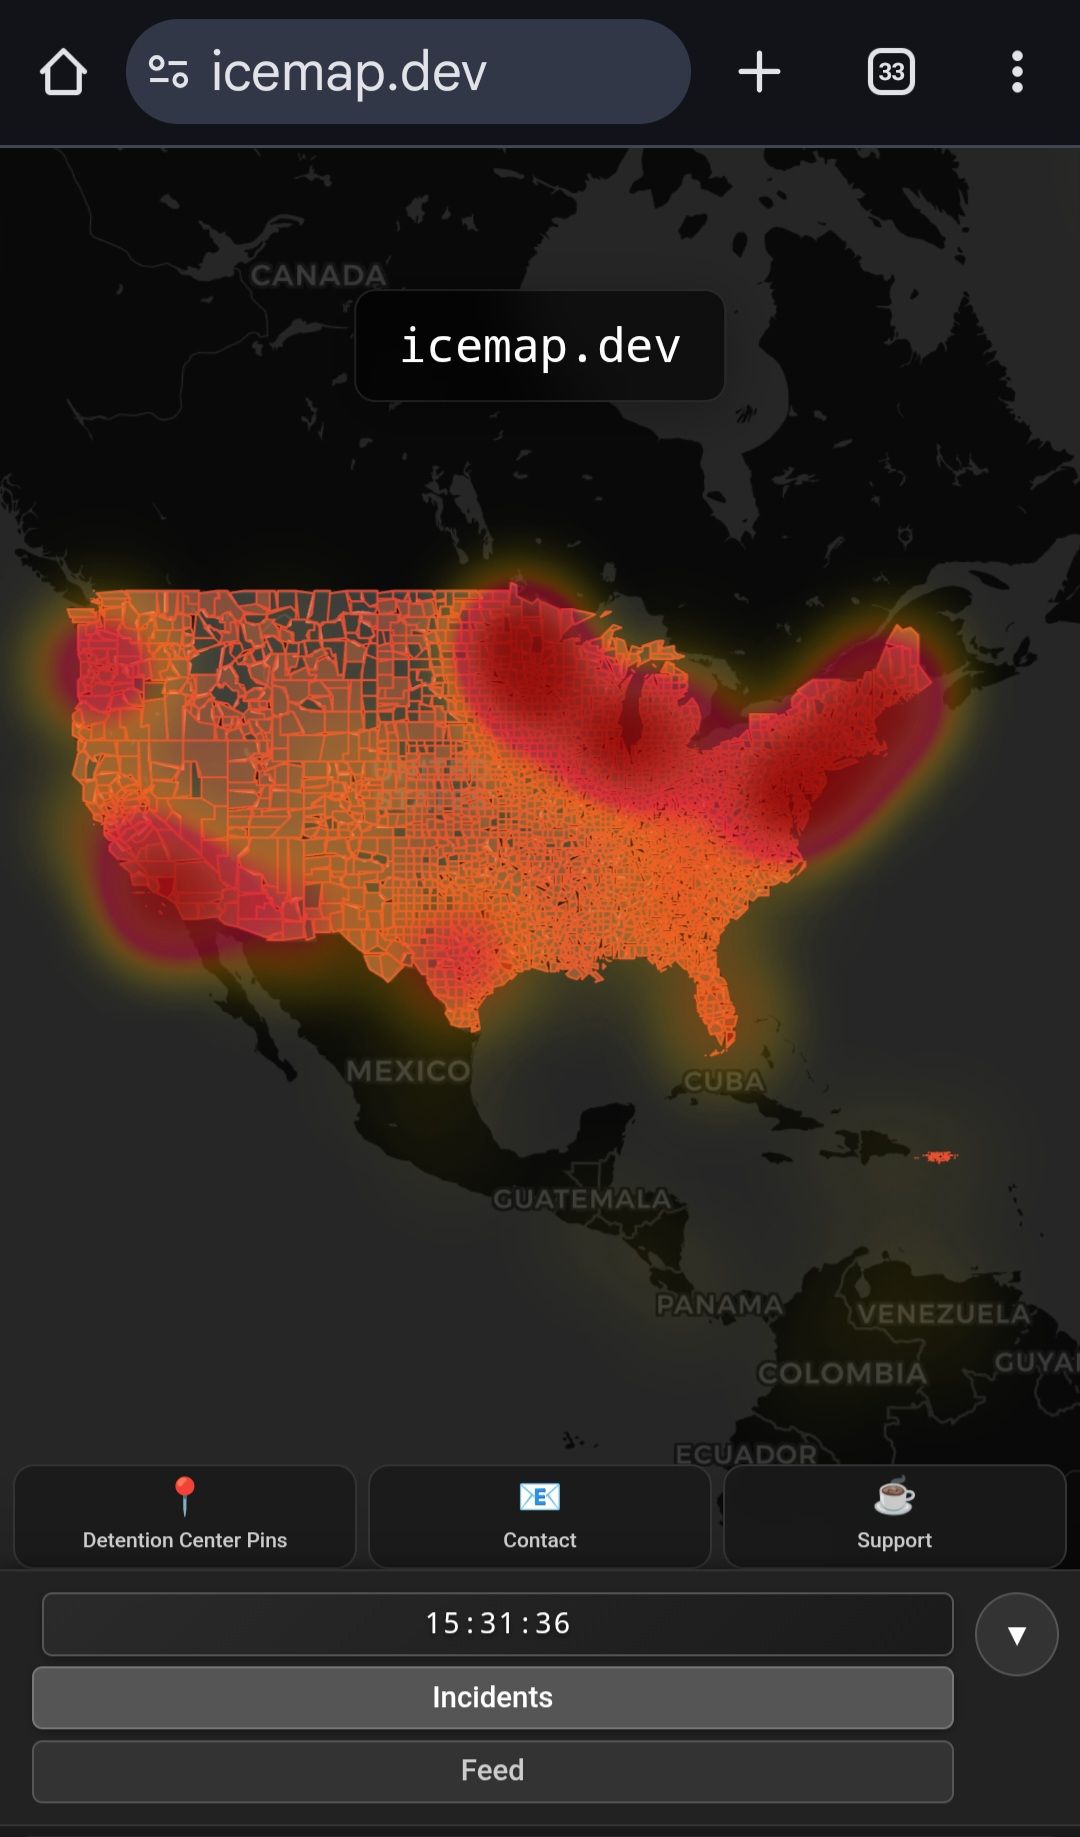
cities /// immi /// murder immigration raids
Executive branch political leadership set enforcement tone. DHS headquarters translated grievance into posture categories. ICE operational commands executed posture selection. Blue-aligned state and city governments absorbed coercive pressure. Red-aligned state governments received protective posture assignment despite higher undocumented population totals. Industrial employers in red and purple zones absorbed episodic spectacle raids that preserved state-level insulation.
- Immigration enforcement claims to follow safety and scale.
- The numbers show the opposite pattern.
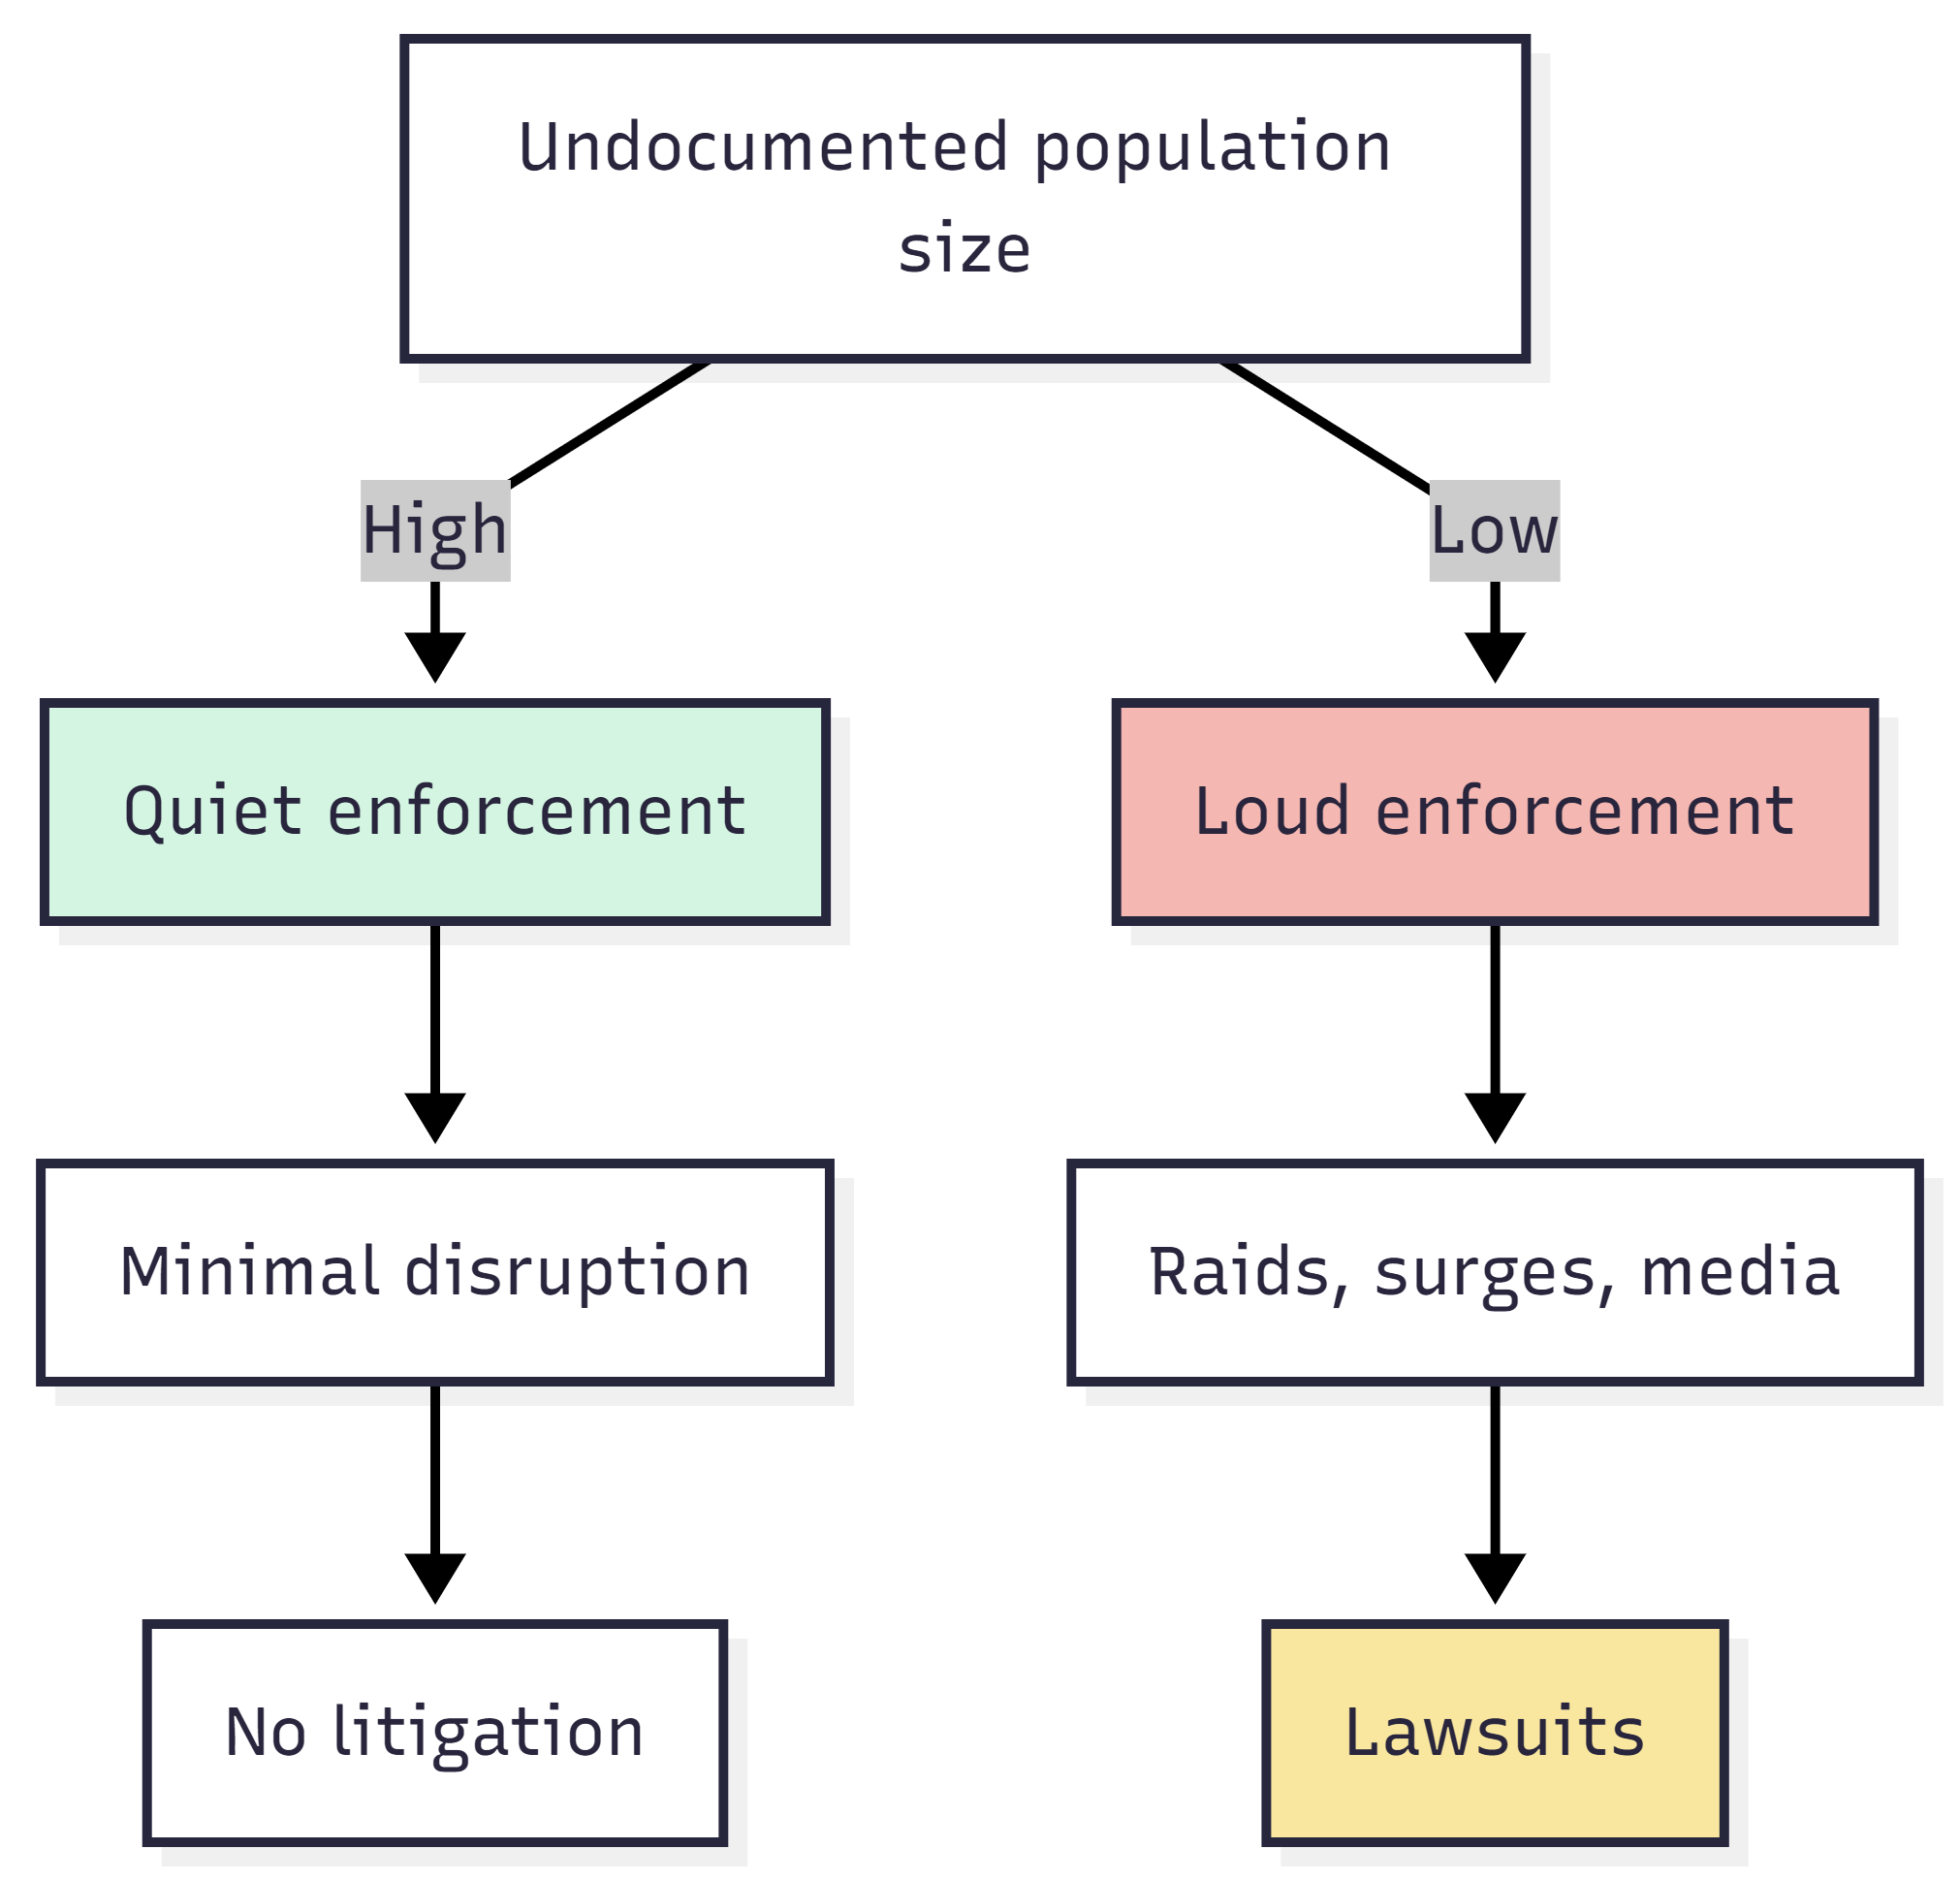
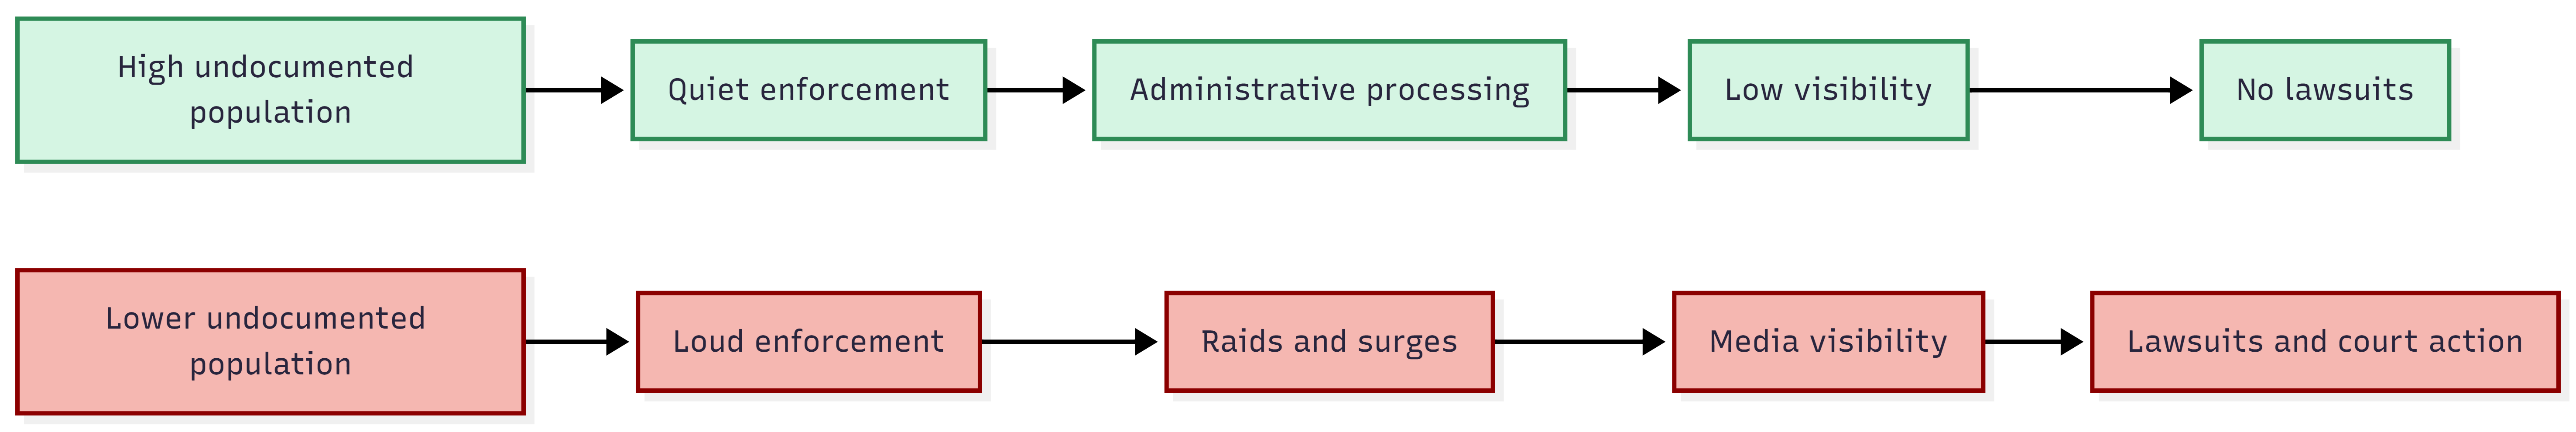
- States with the most undocumented residents face the least enforcement pressure.
- States with fewer undocumented residents face the most visible raids.
- Quiet enforcement protects high-population states.
- Loud enforcement targets politically hostile cities.
- Swing states receive selective pressure, not consistent rules.
- Branded surge operations began after election disputes hardened.
- Lawsuits appear only where saturation tactics appear.
- Enforcement behavior fits punishment logic, not public safety logic.
OVERALL TOTAL – undocumented population by political alignment
Totals reflect cleaned midpoint handling for ranges and conservative handling for “<” values.
| Alignment | Total undocumented population |
|---|---|
| BLUE states | 6,400,000 |
| RED states | 6,720,000 |
Difference – RED states exceed BLUE states by ~320,000 undocumented individuals
WAR
WAR represents sustained, multi-vector enforcement pressure against urban jurisdictions. WAR features repeated raids, custody sweeps tied to local release events, heavy field presence, media amplification, and narrative framing around sanctuary defiance. WAR prioritizes disruption over throughput. WAR strains shelters, courts, hospitals, and city budgets.
WAR-SURGE
WAR-SURGE escalates WAR into synchronized, multi-agency saturation. WAR-SURGE includes imported personnel, temporary command centers, branded operations, and accelerated arrest tempo. WAR-SURGE seeks exhaustion rather than compliance. WAR-SURGE functions as punishment theater.
STANDARD
STANDARD represents routine federal processing aligned with cooperative state systems. STANDARD emphasizes administrative handling, low visibility, predictable tempo, and minimal public signaling. STANDARD reduces friction for aligned jurisdictions.
SILENT
SILENT represents deliberate under-visibility despite large undocumented populations. SILENT favors quiet handoffs, employer compliance pipelines, and state-level insulation from public disruption. SILENT protects political allies while preserving enforcement optics elsewhere.
Deployment logic abandons neutral enforcement principles. Metrics show highest undocumented populations inside SILENT states and highest coercive pressure inside WAR and WAR-SURGE blue jurisdictions. Homicide rates fail as a driver. Border proximity fails as a driver. Operational workload fails as a driver. Political alignment explains allocation with far greater fidelity.
Election grievance hardened into governing doctrine after repeated false claims of electoral theft. Political punishment logic migrated from rhetoric into bureaucratic machinery. Sanctuary framing supplied moral cover. Post-election consolidation removed restraint. Administrative continuity allowed posture categories to persist into 2025 and 2026.
Urban blue jurisdictions experienced resource exhaustion, shelter overload, court backlog, and community destabilization. Public trust eroded where federal action appeared retaliatory. Red-aligned states avoided comparable strain despite larger undocumented populations. Industrial raids delivered episodic spectacle without altering state posture labels. Enforcement credibility suffered as metrics contradicted stated safety narratives.
Absent structural constraint, posture sorting persists. WAR and WAR-SURGE expand into additional blue metros under sanctuary justification. SILENT protection remains intact for aligned states. Litigation increases yet lags operational tempo. Federal credibility erosion accelerates. Institutional norms degrade further.
Path one – normalization of punitive federalism
Posture categories harden into permanent tools. Future administrations inherit a politicized enforcement map. Federal authority fragments along partisan lines.
Path two – escalation spiral
Urban resistance triggers larger surges. Federal presence grows heavier. Local services fail under pressure. Civil unrest risk increases.
Path three – legal rupture
Courts intervene after cumulative harm. Injunctions fragment enforcement authority. Compliance chaos follows.
Path four – bureaucratic metastasis
Other federal domains copy posture logic. Grants, inspections, and prosecutions follow partisan sorting. Governance shifts from rule-based to grievance-based.
Executive analytic judgment – dataset-driven
Dataset patterns show political sorting in ICE posture – not sorting by undocumented population size – not sorting by homicide burden. Blue-aligned states cluster inside WAR and WAR-SURGE labels. Red-aligned states cluster inside SILENT and STANDARD labels. Metrics inside the attached files support a targeting posture that tracks partisan geography far more tightly than any public-safety proxy.
Supporting pattern – alignment versus ICE posture
| Alignment | SILENT | STANDARD | WAR | WAR-SURGE |
|---|---|---|---|---|
| BLUE | 0 | 9 | 6 | 5 |
| RED | 14 | 15 | 2 | 0 |
Interpretation
Blue states – WAR and WAR-SURGE dominate the highest-undocumented-state tier inside the files – California 2.3M – New York 825K – New Jersey 600K – Illinois 550K.
Red states – SILENT dominates the highest-undocumented-state tier inside the files – Texas 2.1M – Florida 1.6M – Georgia 479K – North Carolina 380K – Arizona 307K.
Such a split makes no operational sense under a neutral allocation model that prioritizes population size, homicide harm, or simple workload. Allocation logic inside the spreadsheet reads like a map of political enemies plus symbolic stages.
Anomaly set – high undocumented population plus SILENT label
| State | Undocumented estimate | Murder rate field | ICE posture field |
|---|---|---|---|
| Texas | 2,100,000 | 7.1 | SILENT – Full Cooperation Pipeline |
| Florida | 1,600,000 | 6.5 | SILENT – State-Fed Collab |
| Georgia | 479,000 | 9.9 | SILENT – Processing Hub |
| North Carolina | 380,000 | 8.5 | SILENT – Regional Collab |
| Arizona | 307,000 | 7.5 | SILENT – Border Protocols |
Neutral allocation logic rarely hides the largest problem sets behind “silent” labels. Political allocation logic hides friendly territory behind low-friction processing while projecting force inside hostile territory.
WHY THE NUMBERS BREAK THE OFFICIAL STORY
The administration narrative claims enforcement follows danger, disorder, and scale. The spreadsheet contradicts that claim.
A rational system does not
– Shield the largest population concentrations
– Saturate smaller ones
– Hide friendly jurisdictions behind silence
– Punish hostile jurisdictions with spectacle
Yet the totals prove exactly that behavior.
Red states hold more undocumented residents
Blue states absorb more visible coercion
Numbers do not lie. Bureaucracies lie with numbers.
Anomaly set – low undocumented population plus WAR-SURGE label
Minnesota appears as WAR-SURGE inside the city file via Operation Metro Surge. Minnesota also carries a comparatively modest undocumented estimate in the state file tier. Local press and government filings describe a surge of federal personnel and aggressive enforcement activity inside the Twin Cities. Saint Paul and Minnesota’s Attorney General describe the surge as unconstitutional and retaliatory.
Federal immigration enforcement operates under broad statutory authority. Discretion exists in how resources deploy. That discretion, however, still requires consistency with stated objectives such as public safety, workload management, and risk prioritization.
A review of publicly available population estimates and enforcement posture descriptions shows a recurring mismatch. States hosting the largest undocumented populations experience comparatively low-visibility enforcement. Meanwhile, jurisdictions with smaller undocumented populations experience sustained, high-visibility operations.
That pattern does not align with neutral workload distribution. A rational enforcement model would concentrate resources where population size, risk indicators, or demonstrated harm appear greatest. Instead, enforcement pressure concentrates in politically adversarial urban areas, while cooperative or aligned jurisdictions experience quieter administrative processing.
Time sequencing adds context. Branded multi-city surge operations expanded after the 2024 election cycle. Litigation followed those operations, not routine enforcement. Courts responded to saturation tactics rather than standard processing.
These observations do not allege illegality. They raise governance concerns. Enforcement credibility depends on consistency between justification and action. When actions contradict stated rationales, trust erodes, regardless of political preference.
A durable immigration system requires transparency, proportionality, and restraint. Resource allocation that appears retaliatory weakens institutional legitimacy and invites judicial intervention.
Retribution indicator – explicit linkage to election grievance
Minnesota’s Attorney General filing narrative includes an unusually direct attribution – retaliation tied to election results and personal grievance. Quoted language in the Minnesota AG communication attributes motive to anger over officials reporting election results that did not declare Trump the winner.
That fact pattern matters because it removes guesswork. Analysts usually infer motive from distribution and timing. Minnesota supplies a stated grievance pathway in a government filing.
Trend – dual-track coercion design in the attached material
Track A – Blue urban centers – coercive saturation
WAR and WAR-SURGE labels concentrate in Blue-aligned areas with large media markets, dense institutions, and protest visibility. Dataset entries name New York, New Jersey, Illinois, California, Minnesota, Oregon, Massachusetts, Washington, Colorado, Pennsylvania as active pressure points. Operation Patriot in Massachusetts and Operation Metro Surge in Minnesota exist in public reporting and official releases.
Track B – Red and Purple industrial zones – single-site spectacle
Worksite raids show up as episodic spikes in red or mixed territory – then the state-level label stays SILENT. Georgia illustrates the model – SILENT at state posture level in the spreadsheet, paired with the largest single-site detention event at the Hyundai and battery construction complex in Ellabell. Public reporting and AP coverage describe roughly 475 detainees and frame the event as historically large for a single site.
Coherence test – homicide proxy versus ICE posture
Red SILENT states in the spreadsheet show a higher average murder-rate field than Blue WAR-SURGE states. A public-safety justification that centers violent crime should push enforcement pressure toward higher-homicide jurisdictions. The spreadsheet shows the opposite tendency – visible pressure clusters in lower-homicide Blue jurisdictions while higher-homicide Red jurisdictions receive SILENT labeling.
That mismatch does not prove motive alone. That mismatch does prove the dataset does not behave like a violence-reduction model.
Targeting logic that fits the metrics – working model
Political punishment logic fits the distribution best – not border proximity – not homicide burden – not undocumented population size.
Operational tells that look unusual – and why they matter
Named operations that read like narrative products
Operation names inside the city file function like branding. Branding fits political theater – not quiet enforcement. Wikipedia entries and reporting describe Operation Metro Surge and Operation Midway Blitz as publicly contested operations, with litigation and media conflict. Treat branding as a psychological operation against jurisdictions, not a pure law enforcement action.
Sanctuary framing plus election grievance linkage
Massachusetts Operation Patriot release language frames “sanctuary” as the enabling harm vector. Minnesota filings frame retaliation tied to election grievance. Combined, those narratives create a permission structure for punishment of political out-groups.
Violence claims versus internal ratios
Public descriptions around Metro Surge include claims about “worst of the worst,” while reporting describes a much smaller violent-crime fraction among arrestees. That gap matches an influence pattern – inflate threat to justify extraordinary measures.
Immigration enforcement does not follow population size.
Large populations receive quiet handling.
Smaller populations receive spectacle.
Courts respond to spectacle, not routine enforcement
A neutral government allocates enforcement pressure where measurable risk concentrates. The attached spreadsheets show a different allocation – punishment pressure clusters in Blue-aligned jurisdictions labeled WAR and WAR-SURGE while Red-aligned jurisdictions with the highest undocumented populations receive SILENT labeling.
Such sorting fits retribution. Metrics contradict the stated public-safety storyline. Minnesota’s own filings place election grievance inside the motive frame, and that linkage drags the pattern out of the shadows and into daylight.
Political targeting thrives on one trick – collapse enforcement into identity – then treat political opponents as hostile territory. The spreadsheet behaves like a campaign map wearing a badge.
WAR and WAR-SURGE operate as instruments of political retribution disguised as immigration enforcement. SILENT and STANDARD function as shields for allies rather than neutral administrative categories. Metrics expose the lie. Largest undocumented populations sit behind SILENT labels. Loudest enforcement falls on jurisdictions guilty of one act alone – rejecting an election falsehood.
No rational safety model behaves like the attached data. No neutral administrator assigns saturation to lower-risk zones while sheltering higher-risk ones. Only a punishment model fits. Only grievance explains the pattern. Only power unchecked by truth produces such asymmetry.
Federal enforcement now resembles a campaign map armed with badges. Governance slides toward vendetta. Institutions absorb damage. Democratic legitimacy erodes under the weight of enforcement used as revenge rather than law.


You must be logged in to post a comment.